Density plot
plot_CV_density.RdPlot cumulative density for precision results
Usage
plot_CV_density(
  input_list,
  xaxes_limit = 50,
  cv_col = c("RT", "Pep_quant", "PG_quant")
)
Arguments
- input_list
A list with data frames and respective information on quantitative or retention time precision.
- xaxes_limit
Numeric. Limit of x-axes in plot.
- cv_col
Character string. Choose between "RT", "Pep_quant", "PG_quant" for corresponding precision category. Default is RT for retention time precision. Pep_quant equals quantitative precision on peptide-level. PG_quant equals quantitative precision on proteingroup-level.
Examples
# Load libraries
library(dplyr)
#>
#> Attaching package: 'dplyr'
#> The following objects are masked from 'package:stats':
#>
#> filter, lag
#> The following objects are masked from 'package:base':
#>
#> intersect, setdiff, setequal, union
library(comprehenr)
library(tibble)
# Example data
set.seed(123)
data <- list(
"A" = tibble::tibble(
Analysis_mpwR = rep("A", times = 10),
CV_Retention.time_mpwR = sample(1:20, 10),
CV_Peptide_LFQ_mpwR = sample(1:30, 10),
CV_ProteinGroup_LFQ_mpwR = sample(1:30, 10)),
"B" = tibble::tibble(
Analysis_mpwR = rep("B", times = 10),
CV_Retention.time_mpwR = sample(1:20, 10),
CV_Peptide_LFQ_mpwR = sample(1:30, 10),
CV_ProteinGroup_LFQ_mpwR = sample(1:30, 10))
)
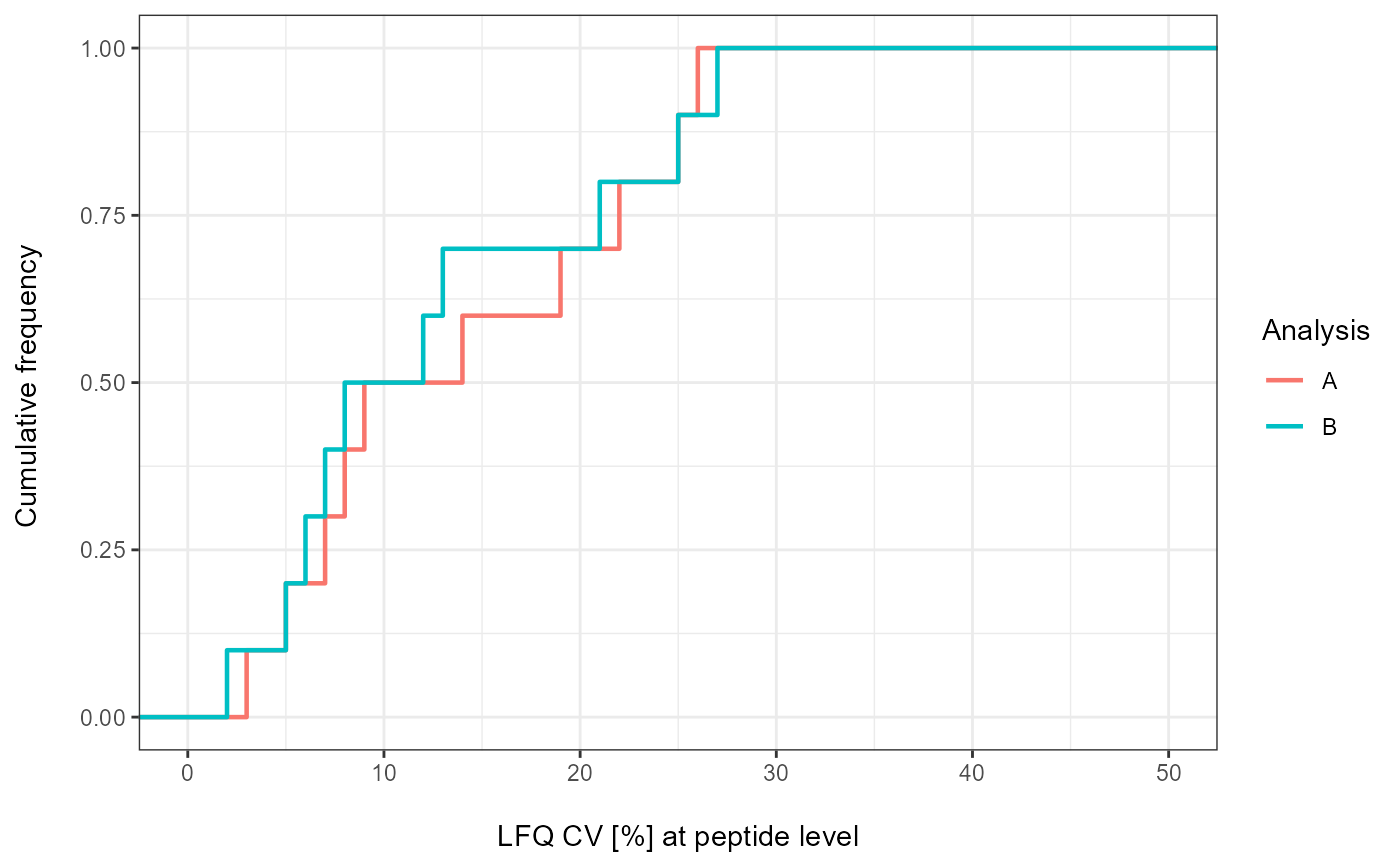
# Plot
plot_CV_density(
input_list = data,
cv_col = "Pep_quant"
)