Individual Barplots - Identifications
plot_ID_barplot.RdPlot number of achieved identifications per analysis.
Usage
plot_ID_barplot(
  input_list,
  level = c("Precursor.IDs", "Peptide.IDs", "Protein.IDs", "ProteinGroup.IDs")
)Details
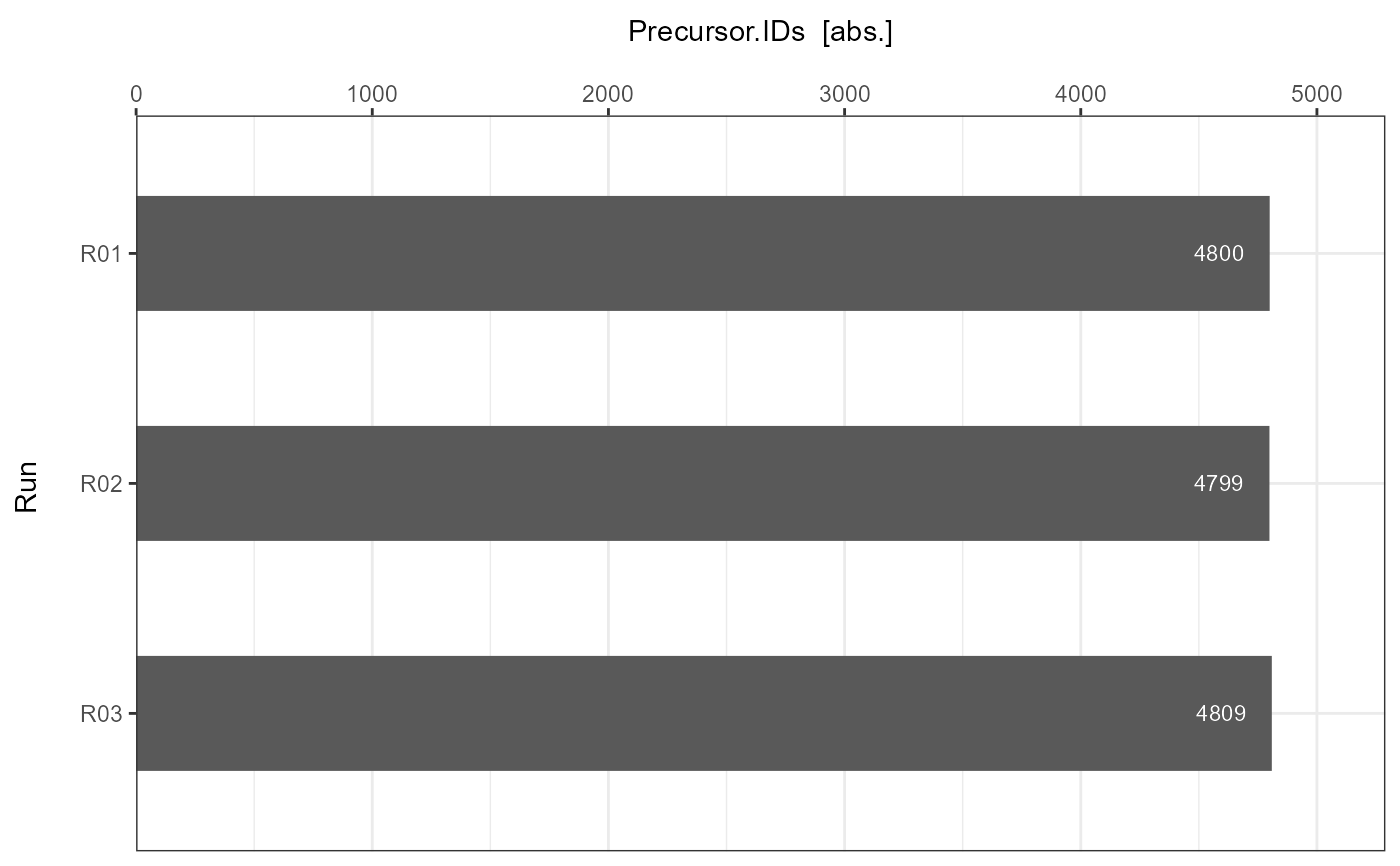
For each submitted individual analysis a detailed barplot is generated with information about the number of achieved identifications per run.
Examples
# Load libraries
library(magrittr)
library(comprehenr)
library(tibble)
# Example data
data <- list(
"A" = tibble::tibble(
Analysis = c("A", "A", "A"),
Run = c("R01", "R02", "R03"),
Precursor.IDs = c(4800, 4799, 4809),
Peptide.IDs = c(3194, 3200, 3185),
Protein.IDs = c(538, 542, 538),
ProteinGroup.IDs = c(487, 490, 486)
),
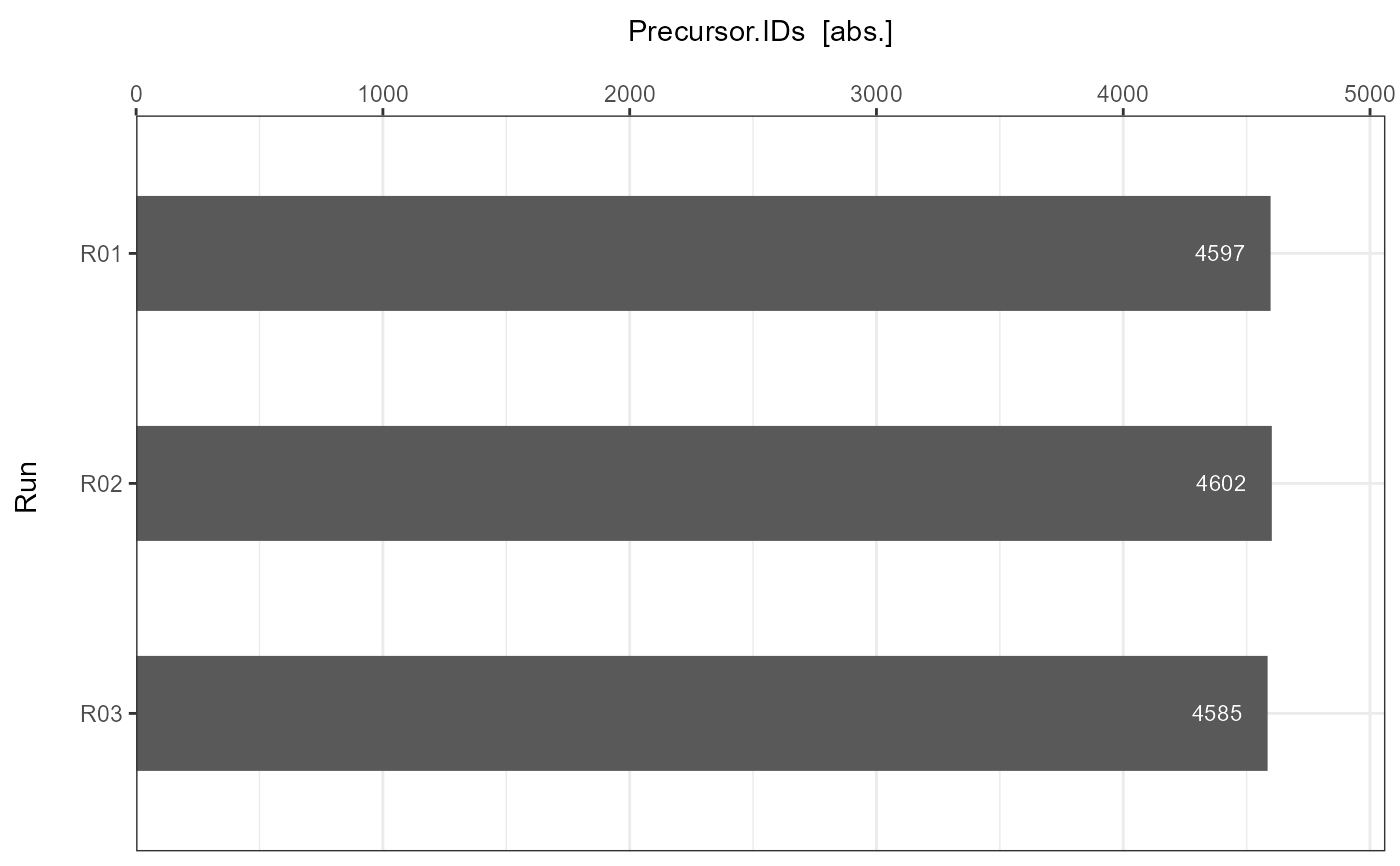
"B" = tibble::tibble(
Analysis = c("B", "B", "B"),
Run = c("R01", "R02", "R03"),
Precursor.IDs = c(4597, 4602, 4585),
Peptide.IDs = c(3194, 3200, 3185),
Protein.IDs = c(538, 542, 538),
ProteinGroup.IDs = c(487, 490, 486)
)
)
# Plot
plot_ID_barplot(
input_list = data,
level = "Precursor.IDs"
)
#> $A
 #>
#> $B
#>
#> $B
 #>
#>