Summary Boxplot - Identifications
plot_ID_boxplot.RdPlot summary of number of identifications in boxplot.
Usage
plot_ID_boxplot(
  input_list,
  level = c("Precursor.IDs", "Peptide.IDs", "Protein.IDs", "ProteinGroup.IDs")
)Details
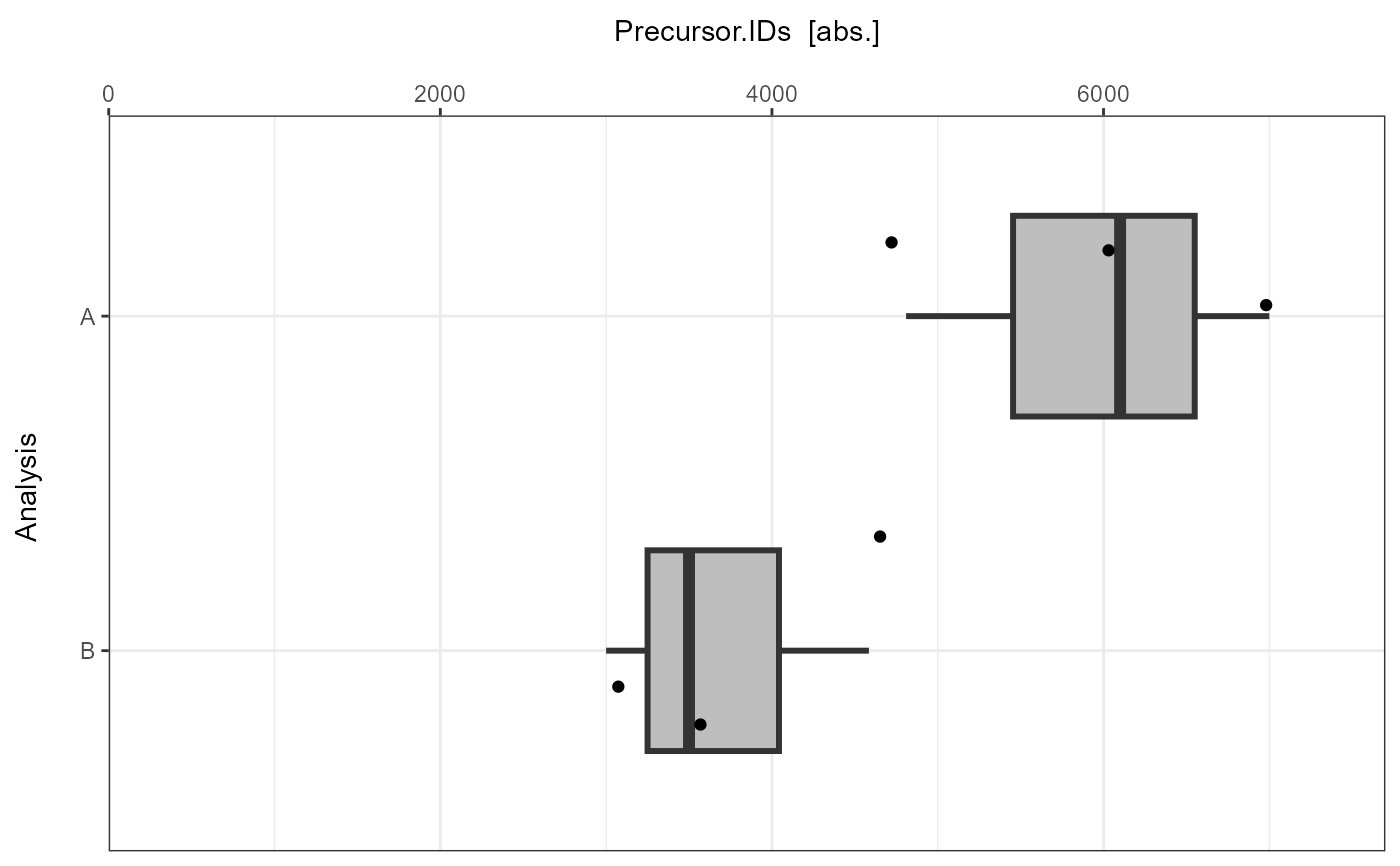
The analyses are summarized in a boxplot displaying information about the number of achieved identifications.
Examples
# Load libraries
library(magrittr)
library(dplyr)
library(tibble)

# Example data
data <- list(
 "A" = tibble::tibble(
   Analysis = c("A", "A", "A"),
   Run = c("R01", "R02", "R03"),
   Precursor.IDs = c(7000, 6100, 4809),
   Peptide.IDs = c(3194, 3200, 3185),
   Protein.IDs = c(538, 542, 538),
   ProteinGroup.IDs = c(487, 490, 486)
 ),
 "B" = tibble::tibble(
   Analysis = c("B", "B", "B"),
   Run = c("R01", "R02", "R03"),
   Precursor.IDs = c(3000, 3500, 4585),
   Peptide.IDs = c(3194, 3200, 3185),
   Protein.IDs = c(538, 542, 538),
   ProteinGroup.IDs = c(487, 490, 486)
 )
)

# Plot
plot_ID_boxplot(
  input_list = data,
  level = "Precursor.IDs"
)