Individual Barplots - Missed Cleavages
plot_MC_barplot.RdPlot number of missed cleavages for each analysis.
Usage
plot_MC_barplot(input_list, label = c("absolute", "percentage"))Details
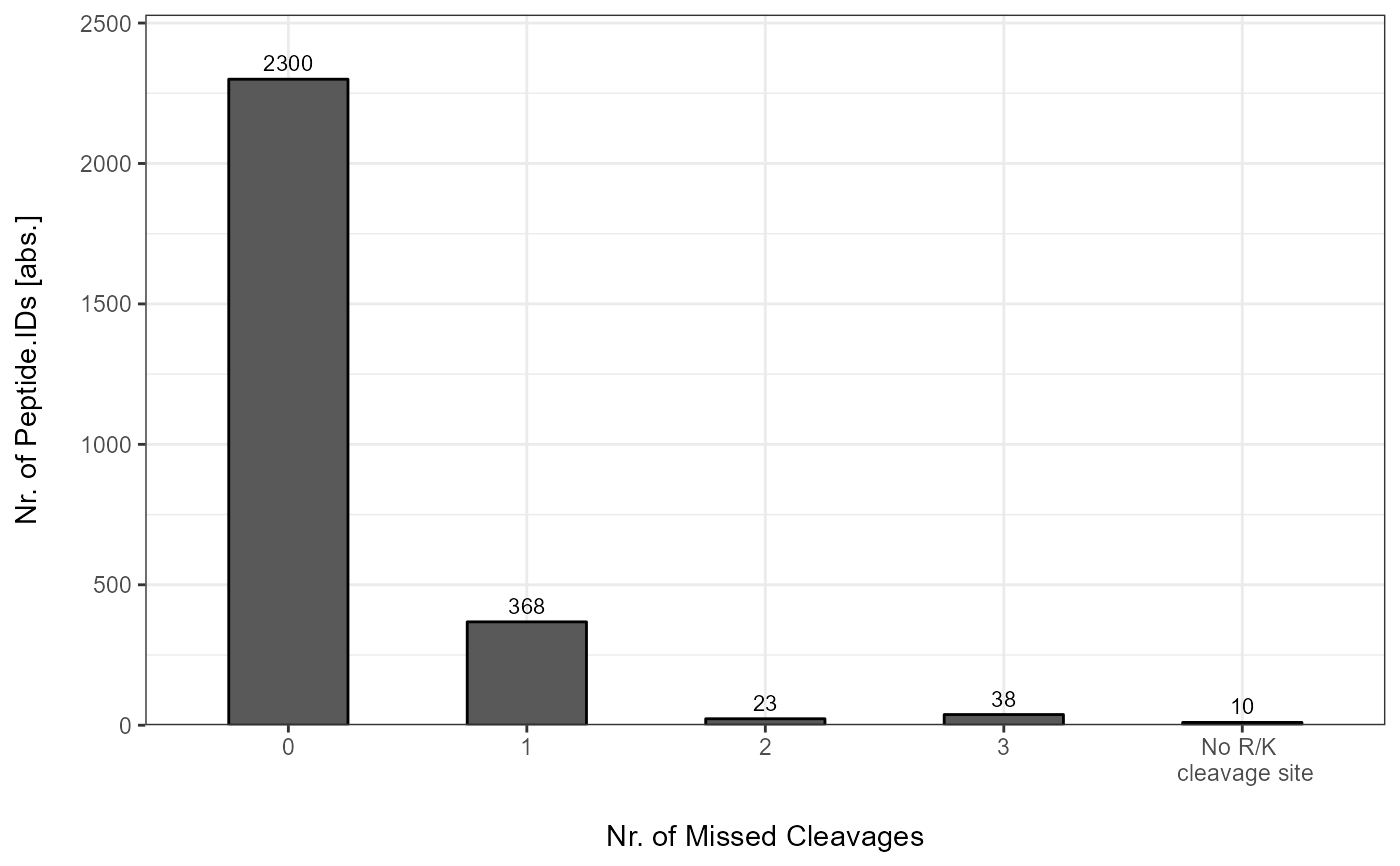
For each submitted individual analysis a detailed barplot is generated with information about the number of missed cleavages.
Examples
# Load libraries
library(comprehenr)
library(tibble)

# Example data
data <- list(
 "A" = tibble::tibble(
   Analysis = c("A", "A", "A", "A", "A"),
   Missed.Cleavage = c("0", "1", "2", "3", "No R/K cleavage site"),
   mc_count = c("2513", "368", "23", "38", "10")
 ),
 "B" = tibble::tibble(
   Analysis = c("B", "B", "B", "B", "B"),
   Missed.Cleavage = c("0", "1", "2", "3", "No R/K cleavage site"),
   mc_count = c("2300", "368", "23", "38", "10")
 )
)

# Plot
plot_MC_barplot(
  input_list = data,
  label = "absolute"
)
#> $A

#>
#> $B

#>
#> $B
 #>
#>