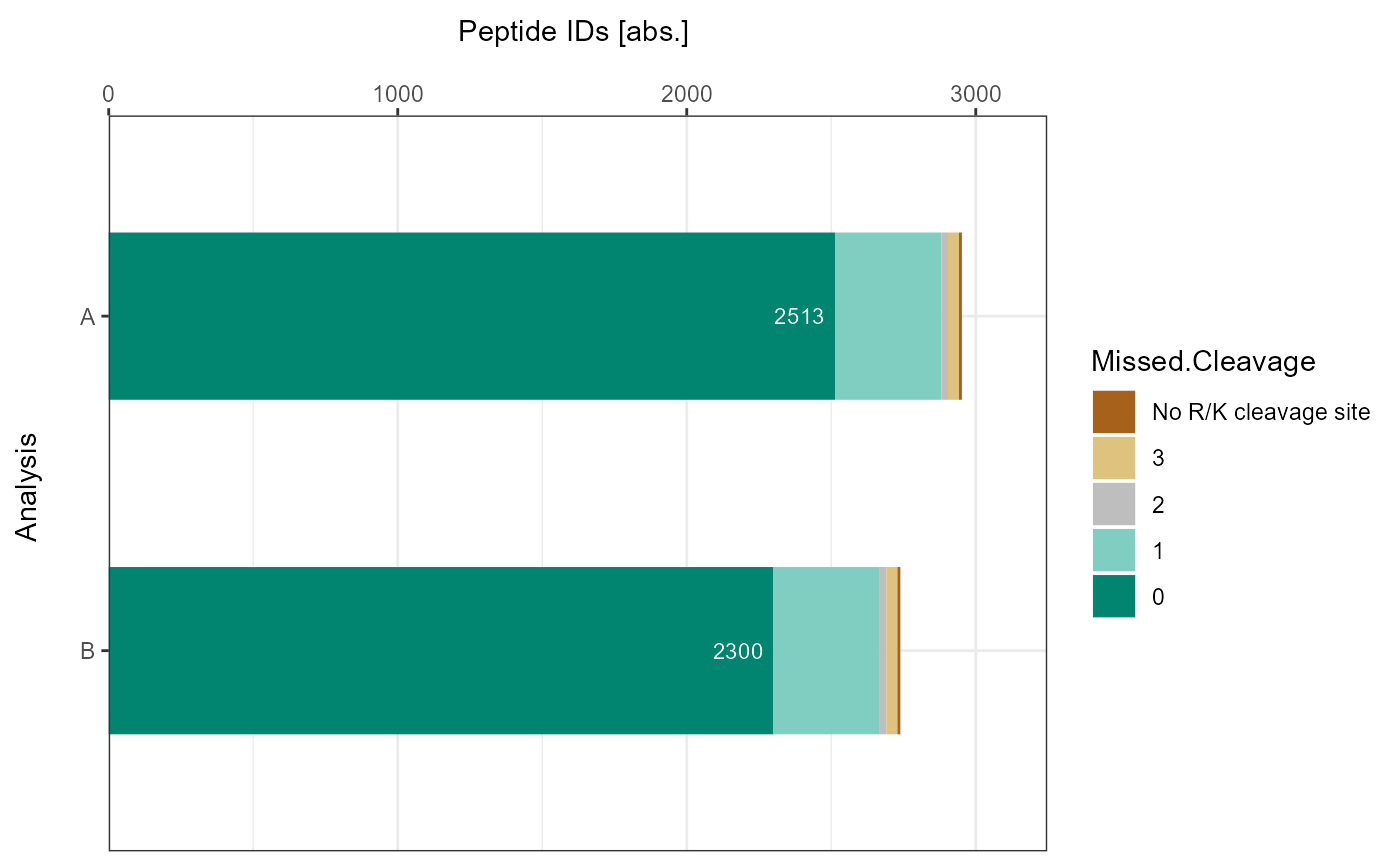
Summary Barplot - Missed Cleavages
plot_MC_stacked_barplot.RdPlot number of missed cleavages as stacked barplot.
Usage
plot_MC_stacked_barplot(input_list, label = c("absolute", "percentage"))Details
The analyses are summarized in a stacked barplot displaying information about the number of missed cleavages.
Examples
# Load libraries
library(dplyr)
library(tibble)

# Example data
data <- list(
 "A" = tibble::tibble(
   Analysis = c("A", "A", "A", "A", "A"),
   Missed.Cleavage = c("0", "1", "2", "3", "No R/K cleavage site"),
   mc_count = c("2513", "368", "23", "38", "10")
 ),
 "B" = tibble::tibble(
   Analysis = c("B", "B", "B", "B", "B"),
   Missed.Cleavage = c("0", "1", "2", "3", "No R/K cleavage site"),
   mc_count = c("2300", "368", "23", "38", "10")
 )
)

# Plot
plot_MC_stacked_barplot(
  input_list = data,
  label = "absolute"
)