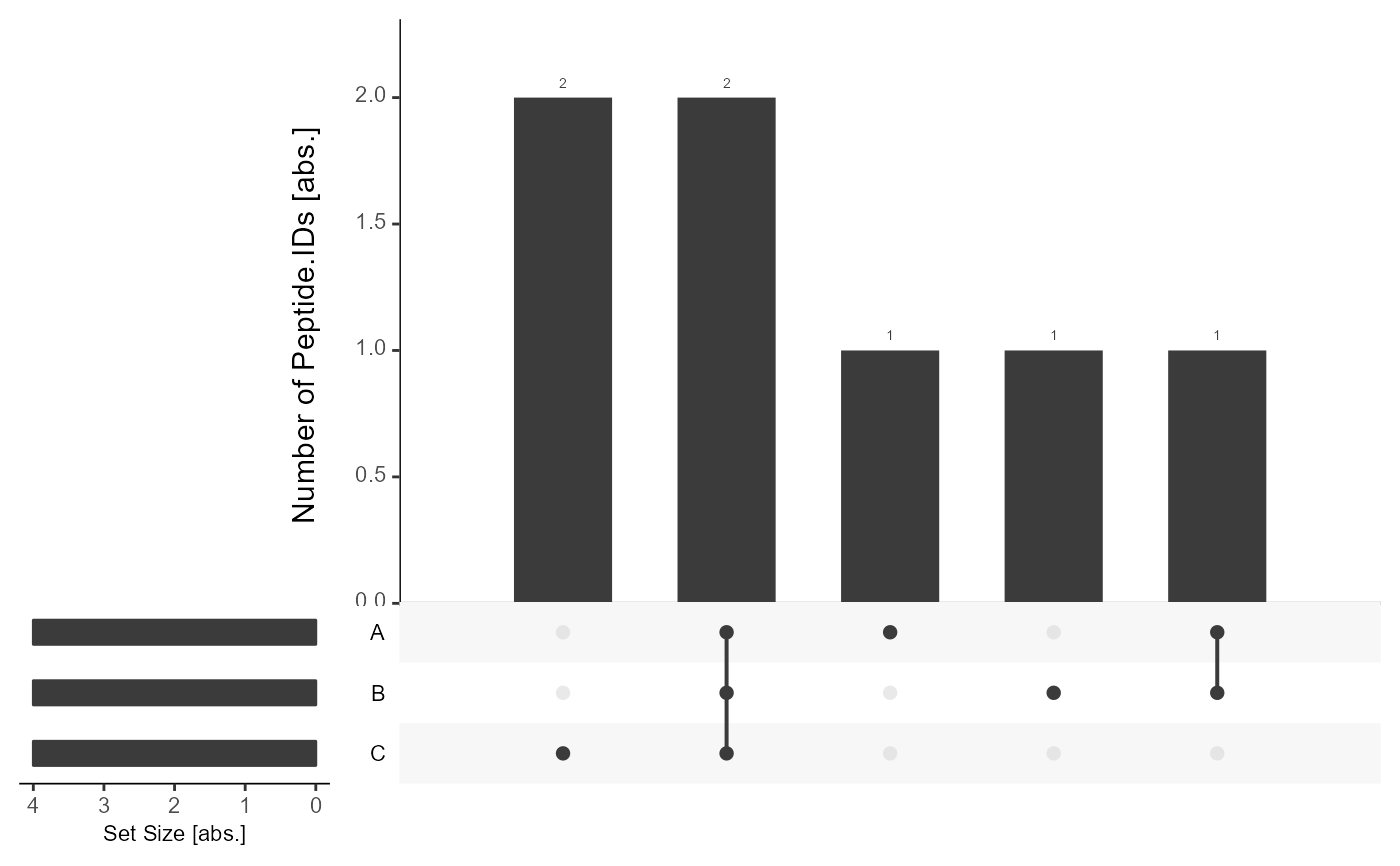
Upset Plot
plot_Upset.RdPlot intersections of analyses for different levels.
Usage
plot_Upset(
  input_list,
  label = c("Precursor.IDs", "Peptide.IDs", "Protein.IDs", "ProteinGroup.IDs"),
  nr_intersections = 10,
  highlight_overlap = FALSE
)
Arguments
- input_list
A list with data frames and respective level information.
- label
Character string. Choose between "Precursor.IDs", "Peptide.IDs", "Protein.IDs" or "ProteinGroup.IDs" for corresponding level. Default is "Precursor.IDs".
- nr_intersections
Numeric. Maximum number of intersections shown in plot. Default is 10.
- highlight_overlap
Logical. If TRUE, overlapping intersections is highlighted in yellow. Default is FALSE. If TRUE, overlapping intersections need to be in plot!